Time Spent on Top Web Properties
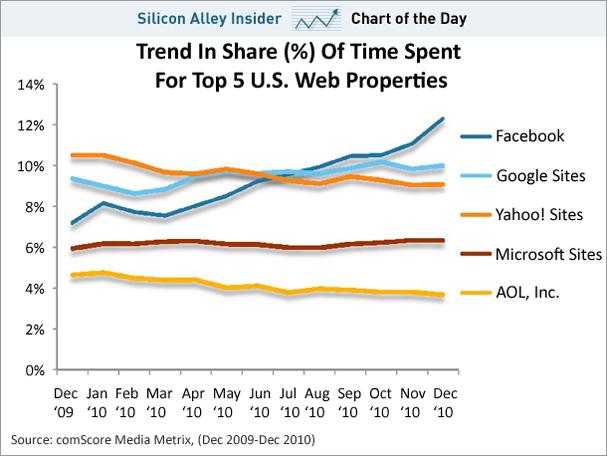
In my blog entry Time Spent on Facebook, Google, Yahoo, it was revealed that Facebook and Google have surpassed Yahoo in terms of time people spend on Web properties. Here is an extended look at the share of time on top 5 U.S. Web properties.

Yahoo started as number one at the beginning of 2010 and around mid-year 2010, Facebook overtook Yahoo, then Google shortly after that. Is it likely that Yahoo will reclaim the top position? Not likely. Will Yahoo drift down even more? Possible. Coopetition amongst the bottom three might be the way to reverse the downtrend in order catch the top two.
Related data from ComScore reveals that while Google and Yahoo sites remain the most-visited Web properties in the U.S., with about 180 million visitors a month, Facebook is getting more engagement time from visitors. As per the chart above, Facebook accounts for 12.3% of time spent online in the U.S. as of year-end 2010. i.e. Facebook sucks 12.3% of your time on the Internet!
Other ComScore findings include:
- Google search remained number 1, with 66.6 percent of the search market in December 2010. Yahoo was second at 16 percent. Microsoft reached its 2010 high point in December 2010.
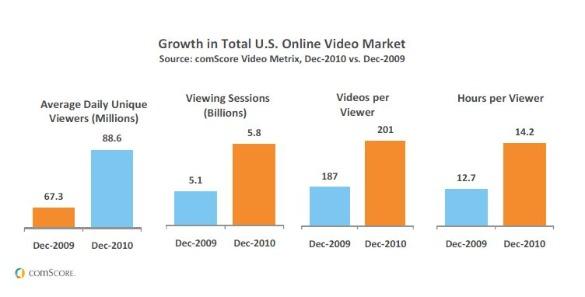
- An average of 179 million people are watching online videos on sites such as YouTube and Vimeo each month. On an average day in December 2010, 88.6 million people watched online video.

2010 Aug Sep Oct Nov Dec
2011 Jan Feb Mar Apr Jun Sep Oct Dec
2012 Jan Feb Apr May Jun Oct Nov Dec
2013 Jan Feb Mar May Jun Dec
2014 Jan Mar Jun Jul Aug Oct Nov Dec
2015 Jan Feb Mar Apr May Jun Oct Nov Dec
2016 Jan Feb Mar Apr May Jun Jul Aug Sep Oct Nov Dec
2017 Jan Feb Apr Oct
2018 Jan Feb Mar Apr
2020 Mar Apr May


